

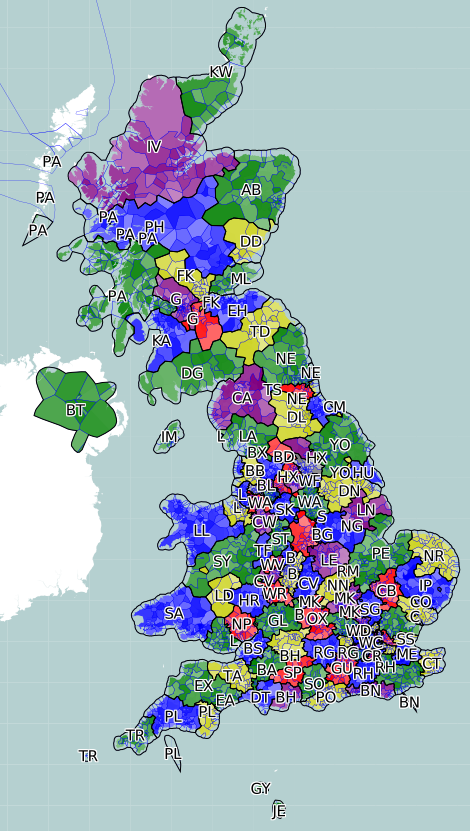
Barclays Mortgages have recently launched the Postcode Property Index, which analyses the top UK postcodes from 20 cities that have seen the fastest house price growth over the past year. According to the new data, B16, covering Ladywood in Birmingham leads, with regional cities overtaking London as employment growth and attractive affordability boost demand for housing and boost house prices.
The Index shows that individual postcodes are resisting the national housing market trend. The latest government figures show a downturn in house price growth with September 2017 showing just a 0.4% increase, suggesting the housing market is continuing to calm the post-EU referendum.
Despite these figures, data sourced from property analysts Hometrack has revealed that property prices in B16 (Ladywood) in Birmingham, which benefits from a plethora of restaurants chains and artisan coffee shops has seen property prices increase to an average of £171,121 in the past 12 months, an increase of 17 per cent – significantly more than the 5 per cent increase experienced by the city as a whole.
In Edinburgh, those living in EH2 have seen their property values rise on average by nearly £50,000, or 14%, in just one year. The regional cities, however, have fared less well in the past year. The average price growth in London fell to just 2% in the last year. Clapton saw the largest increase in property prices in the city, but this still only came in at 5% which is considerably lower than the figures that homeowners have come to expect in London.
Craig Calder, Director of Barclays Mortgages said:
“It is fascinating to see the individual postcodes where property prices are growing at a very fast pace, particularly when they are significantly outstripping the city’s average growth. It demonstrates how changeable the property market currently is, not just around the UK but within each city.”
| City | Postcode | Area | Avg House Price (Jul 16) | Avg House Price (Jul 17) | % Growth | Avg % Growth |
| Birmingham | B16 | Ladywood | £147,121 | £171,498 | 17% | 5% |
| Edinburgh | EH2 | Holyrood | £325,595 | £372,592 | 14% | 7% |
| Glasgow | G3 | Finnieston | £161,454 | £183,298 | 14% | 5% |
| Manchester | M11 | Openshaw | £93,774 | £105,832 | 13% | 7% |
| Hull | HU1 | Central Hull | £86,778 | £97,742 | 13% | 4% |
| Bradford | BD3 | Barkerend | £77,413 | £85,978 | 11% | 3% |
| Leicester | LE18 | Wigston | £162,611 | £177,263 | 9% | 4% |
| Coventry | CV1 | Bishopsgate Green | £120,377 | £130,098 | 8% | 7% |
| Bristol | BS1 | Bristol | £255,729 | £276,242 | 8% | 4% |
| Nottingham | NG11 | Ruddington | £151,025 | £162,430 | 8% | 5% |
| Belfast | BT5 | East Belfast | £123,527 | £131,690 | 7% | 3% |
| Sheffield | S3 | Neepsend | £105,501 | £113,359 | 7% | 3% |
| Leeds | LS2 | Woodhouse | £141,162 | £151,391 | 7% | 4% |
| Liverpool | L21 | Litherland | £92,967 | £99,417 | 7% | 3% |
| Brighton | BN41 | Portslade | £289,550 | £305,564 | 6% | 2% |
| London | E5 | Clapton | £511,300 | £541,800 | 5% | 2% |
| Wakefield | LS26 | Central Wakefield | £167,480 | £176,522 | 5% | 3% |
| Cardiff | CF24 | Adamsdown | £163,344 | £170,385 | 4% | 3% |
| Newcastle | NE15 | Heddon on the wall | £108,203 | £112,830 | 4% | 2% |
| Sunderland | NE35 | Boldon | £113,183 | £117,609 | 4% | 1% |
